Making accurate 5G mmWave measurements with a signal analyzer
By Dylan McGrath, Keysight Technologies
Electronics Test & Measurement Editor Pick measurement testThe commercialization phase of 5G is in full swing. Currently, 5G has been deployed in more than 26,000 sites and counting. However, the vast majority of 5G deployments to date have been Frequency Range 1, sub-6GHz deployments. Deployment of 5G Frequency Range 2 (FR2) has only just begun.
Most, but not all FR2 resides in the millimeter wave (mmWave) spectrum. FR2 is defined as 24.25GHz to 52.6GHz. As shown in Figure 1, mmWave spectrum is generally considered to be the band of spectrum that resides between 30GHz and 300GHz.

Figure 1. mmWave occupies the area of spectrum between 30GHz and 300GHz.
The advantages of using mmWave spectrum in wireless communications have been well documented. The high frequency of mmWave frequencies makes them a very efficient way of sending large amounts of data. The amount of bandwidth available in the mmWave frequency range enables tremendous uplink and downlink speeds, and the relatively small size of mmWave transmissions make mmWave suitable for operating in dense urban environments where a lot of devices are present. In short, FR2 is where the bulk of 5G’s promised benefits reside in terms of speed, bandwidth, and latency for both standard wireless communications as we know it today and for enabling entirely new use cases.
However, as is so often the case in wireless technology, the promise of mmWave comes with strings attached. In the case of mmWave, the tradeoffs include path loss (due to the poor propagation of mmWave signals), increased signal noise (due to the inherent high noise level of wideband signals), and poor frequency responses (due to the small margin for error on wideband signals). Further complicating matters, components designed for mmWave devices are so compact and tightly integrated that it leaves no place to probe, which creates the requirement for radiated tests, also known as over the air-the-air (OTA) tests. These challenges can make measuring mmWave signals arduous, preventing you from understanding the true performance of the device under test.
This article will discuss these specific challenges to mmWave device testing in further detail. It will also present strategies for overcoming these challenges with a signal analyzer using modifications to signal path, signal conditions, and the reference plane, enabling accurate, repeatable measurement of 5G mmWave signals.
Path loss
One of the most significant challenges to overcome for FR2 transmission is that mmWave signals do not propagate as far as microwave frequencies. mmWave signals are easily absorbed by the atmosphere and are more heavily impacted by rain attenuation and diffraction. mmWave signals also do not penetrate trees and other foliage, building walls, freeway overpasses, and other infrastructure.
The finnicky propagation characteristics of mmWave signals can be further exacerbated by the test setup. For example, signals may be hampered by RF cables and accessories. Also, any skew in a flange connection (Figure 2) on the test and measurement equipment can cause unwanted reflections that degrade signal quality and power. The OTA testing requirement also complicates matters, because electromagnetic field behavior and characteristics vary depending on the distance from the antenna.

Figure 2. Any skew in a flange connection can cause unwanted reflections that degrade signal quality and power.
Excessive path loss at millimeter-wave frequencies between instruments and the device under test (DUT) results in a lower signal-to-noise ratio (SNR) for signal analysis. A lower SNR leads to less accurate transmitter measurements for things like error vector magnitude (EVM), adjacent channel power ratio (ACPR), and spurious emissions. To compensate for path loss, engineers typically reduce the attenuation of the signal analyzer. However, even reducing the input attenuation of the signal analyzer to 0 dB may not be able to compensate for the low SNR adequately to result in accurate measurements.
Signal analyzers offer engineers the hardware and software flexibility to optimize for specific types of measurements. An example is that signal analyzers offer a choice of multiple RF signal paths to help overcome path loss issues related to signal propagation and other factors. A signal analyzer can, for example, apply attenuation at higher power levels or a preamplifier at lower power levels to measure a variety of input signals.
The types of RF signal paths typically available include:
* The default signal path is ideal for measurement low-level signals with a bandwidth of less than 45MHz. In this path, the input signal travels through the RF attenuator, preamplifier, and pre-selector before reaching the mixer.
* A microwave preselector bypass path is better suited for analyzing wideband vector signals such as mmWave signals because it allows wide-bandwidth signals to pass unimpeded through the RF chain.
* Making EVM measurements and other measurements that test transmitter modulation quality at higher power levels is generally best done using a low-noise signal path. The gain of the amplifier, frequency responses, and insertion loss are compounded at higher frequencies. This path reduces path loss and the frequency responses and noise created by the preamplifiers and switches, improving signal fidelity and increasing measurement sensitivity.
* A full-bypass signal path — which avoids multiple switches in the low-band switch circuitry and bypasses the microwave preselector — can reduce loss at mmWave frequencies by up to 10 dB compared with the default signal path. The full bypass path offers the advantages of lower path loss, higher signal fidelity, and increased measurement sensitivity, but does have some downsides including in-band imaging and low SNR for testing lower power levels.
Use of an external mixer can extend the frequency range of a signal analyzer and eliminate insertion loss caused by the test setup cables and accessories between the signal analyzer and the DUT. The cable loss can be up to 5 dB/m and can reduce the SNR of the test system. Adding an external mixer, which can be moved closer to the DUT, shortens the mmWave signal path, reducing the path loss and increasing the SNR.
Wideband noise
Wideband signals inherently have higher noise and a lower SNR because energy from the signal spreads across the entire bandwidth of the signal. Hence, the wider the bandwidth, the lower the inherent signal integrity, the more vulnerable it is to noise from the test setup and other factors, and thus the lower the SNR.
Noise is part of all communications channels. A transmit signal needs to compete with the channel’s noise floor to get better sensitivity at a receiver. The Shannon-Hartley theorem specifies the maximum rate at which information can be transmitted over a communication channel within a specified bandwidth with the presence of noise.
Increasing analysis bandwidth introduces more noise to a signal analyzer. The noise reduces the SNR. As mentioned above, a low SNR causes inaccurate transmitter measurements. The low SNR can result in poor EVM and ACPR measurements that do not accurately reflect the performance of the DUT.
To improve EVM measurement accuracy, it is important to choose the optimum levels for the signal analyzer’s mixer and digitizer. It is also critical to choose the optimum phase noise configuration of the local oscillator (LO) to achieve the best results.
Wireless standards specify transmitter measurements at the maximum output power. However, you can attenuate the power level at the first mixer of a signal analyzer to ensure that the high-power input signal does not distort the signal analyzer. The input signal level can be lower than the optimum mixer level in OTA tests and tests setups with a significant insertion loss, for example. Using a built-in preamplifier can be useful for low-input-level test scenarios. A built-in preamplifier provides a better noise figure, but a poorer intermodulation-distortion-to-noise-floor dynamic range.
The input mixer-level setting is a trade-off between distortion performance and noise sensitivity. A higher input mixer level yields better SNR, while a lower input mixer level offers better distortion performance. The measurement hardware, characteristics of the input signal, and specification test requirements combine to dictate the optimum mixer-level setting. As shown in Figure 3, applying an external low-noise amplifier (LNA) at the front end can also reduce the system noise figure — with or without the internal preamplifier — can also help optimize the input level of the mixer.
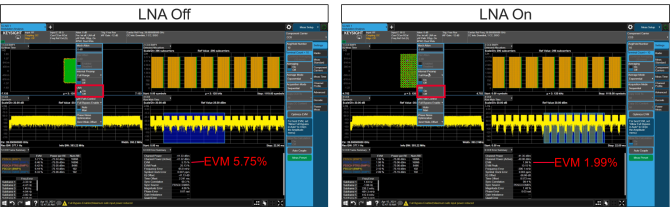
Figure 3. An example of 5G demodulation analysis with the signal analyzers input level lower than its best mixer input level. On the left, the attenuator has been set to 0 dB and the signal path is “full bypass path”. With the LNA turned on (right) the EVM is improves from 5.75% to 1.99%.
Signal analyzers also choices for phase noise optimization. The optimum phase noise performance of a signal analyzer for modulation analysis is dictated by the phase noise profile of the signal analyzer, as well as the operation frequency, bandwidth, and subcarrier spacing (OFDM signal) of the input signal. A wide offset phase noise setting is generally for better 5G NR mmWave modulation analysis.
Frequency responses
The accuracy of the test setup is impacted by the components in path between the test instrument and the DUT. With wide bandwidths and mmWave signals, small margins for error force RF engineers to look for new ways to reduce frequency response errors. These frequency response errors occur at different frequencies, affecting phase and amplitude responses. A signal analyzer provides an internal calibration routine to correct its frequency responses.
Correcting for frequency response errors is required in order to extend the measurement accuracy from the signal analyzer’s input port to the DUT’s test port. It is possible to configure corrections to both amplitude and phase with a signal analyzer to remove frequency responses. Correcting for magnitude and phase errors in the test network also improves the accuracy of measurements. There are many instruments and accessories available to help correct frequency responses.
Conclusion
In summary, the use of mmWave signals in 5G enables dramatic improvements in speed and latency, offering the performance to significantly boost traditional wireless data applications and enable entirely new use cases such as ultra-low-latency communications (URLLC), cellular vehicle-to-everything (C-V2X) communications, and massive machine-type communications (mMTC). However, the characteristics of mmWave signals introduce new measurement challenges to accurate, repeatable measurement. Modern signal analyzers provide the flexibility in hardware and software to offset these challenges, including reducing path loss, improving signal condition, and correcting for frequency response errors.

Dylan McGrath is a veteran technology journalist and presently serving the role of senior industry solutions manager at Keysight Technologies.