Stop wasting time and money by struggling with data analytics while designing T+M experiments
By Brad Doerr and Ailee Grumbine, Keysight Technologies Inc.
Electronics Test & Measurement Engineering Supply Chain data analytics T&M T+M experiments test testDeliver products to market faster by using modern data analytics tools
The design-to-manufacturing (D2M) process typically involves sequential stages of design, simulation, fabrication, validation, compliance testing and manufacturing. Each stage requires data collection typically specified in an initial design of experiments (DOE) and aimed at providing confidence that the design can meet critical requirements. Effective data analytics tools can help engineers evaluate insights available within the dataset collected per the DOE in each stage of the design-to-manufacturing process. Time-to-market (TTM) can be greatly accelerated by utilizing modern data analytics tools while also increasing confidence in key technical decisions.
Today’s design work flow
The first two stages of the D2M process are design and simulation. After the initial design is completed, the designer will perform simulation to ensure the design will meet the required design specification. The simulation can provide some key statistics and additionally produces waveforms that can be fed into compliance test applications that can validate industry-standard interfaces that are integrated into the design (e.g. DDR, USB, or PCIE). Simulation validation is a critical task to handle prior to committing to fabrication which is typically very expensive for ASICs and complex printed circuit boards. This stage generates a great amount of data and measurement results which should be archived for later comparison with physical testing.
After fabrication, the next stage of the design work-flow is physical validation of the design. Design validation is performed on newly built devices (DUTs) by using test equipment such as oscilloscopes, bit error rate testers, and other measurement devices. At this stage, validation engineers will make measurements on multiple samples of the design per the DOE created during the design stage. In the validation stage, the goal is to make many of the same measurements made in the simulation stage ñ but this time on real hardware. The DOE typically requires validation in a wide range of operating conditions, such as temperature, input voltage, and various software configurations ñ a lot of data is gathered during this process. Furthermore, these tests must be made many times across many physical samples to ensure statistical significance of the test results.
As the engineering team is collecting the data, they will analyze the data to determine how the design has performed. This analysis is often slowed because of awkward or tedious tools and data management. The data comes from a wide range of instruments from various vendors with data in CSV, XML, binary, or other various formats. The data is often stored in multiple places and managed by multiple people. Furthermore, the analysis is often handled with a variety of tools such as databases, Excel spreadsheets, PIVOT tables, JMP, MATLAB, R and/or other home-grown tools. The challenge is compounded by the fact that most engineering teams directly manage this data and the home-grown tools and processes – and this distracts from making measurements and promptly analyzing the findings.
Testing must include a wide range of conditions
Once the design has been validated for basic system performance, the engineering team will progress to compliance testing on the physical DUT to validate that key interfaces fully comply with industry standard interfaces. Again, this testing must include a wide range of conditions, each with multiple measurements across multiple DUTs. The use of a trusted compliance application is ideal in this stage. Automated compliance test software can save a lot of time as it makes all the required measurements in an automated process and produces the test report with statistical analysis based on the test limits specified in the corresponding industry standard. This allows the engineers to characterize and determine the margins they have in their designs. It also enables a backward compare to the original simulated design results. This enables an apples-to-apples compare of empirical test data with the original design intent. This data is also very useful if/when the first build is not sufficient for manufacturing release and a second design cut is needed.
Once the design is fully validated, the design can move to the manufacturing stage. As the manufacturing team is preparing to begin production, they will need to identify the production processes and measurements that will be made to ensure the design will meet the manufacturing goals. Often these goals are derived from the original DOE created at the start of the program. As such, the manufacturing team will also need to have access to the design and validation data. By using a modern data analytics solution, this data will be readily accessible by the manufacturing team. As production ramps-up, the manufacturing team will progress into the manufacturing optimization stage – seeking efficiency improvements and/or yield improvements to improve profitability. Again, the data is critical to driving these improvements. Along the way, the manufacturing team will typically capture many of the same data that was captured in the early stages of development. Together this data provides the basis for effective manufacturing management and optimization.
Start with a clear DOE and then choose the right analytics tool
Clearly data management and information insight is key to a successful D2M program. A capable data analytics platform will help, and by integrating the DOE at the start of the process, the engineering team will be able to achieve efficiency and confident decisions.
The DOE is created in the early stages of design and it is aimed at providing the data that can answer key questions about the design (e.g. will it meet the key specs, how will it perform in various conditions, how much power will it consume). This DOE then defines the tests required to run in simulation and on the physical DUTs. The DOE also identifies the test conditions and the number of tests that need to be run to achieve statistical confidence in the results. At this stage, it is also important for the team to identify the tools (e.g. oscilloscopes and/or compliance apps) needed to run the tests in simulation and physical environments. Itís also critical the simulation and validation teams use the same measurement tools and algorithms to ensure apples/apples comparison of results. Failing to do this will ensure doubt in the teamís decision making process.
Yes, the DOE will evolve during the program, and it is critical to choose a data analytics platform that can adapt alongside the DOE evolution. Nobody likes to delay a program while the IT team ìre-architects the database schemaî.
There are some key elements to a suitable data analytics platform:
* Can store all measurement data (bulk and real-time upload)
* Compatible with sim and measurement tools from any vendor (any format)
* High availability, backed-up, secure, enterprise-class performance
* Enable the team to run in parallel – adding data in parallel (from multiple sites/geographies)
* Low maintenance for the engineering team
* Flexible to real-time DOE changes (these will invariably happen and shouldn’t slow the team down)
* Enable the entire team to retrieve the data promptly and perform analytics (from any location)
* Easy to use analytics so the entire team can participate in identifying insights and making decisions
* Export to other deeper analytic tools for custom analysis
* Automatic report generation.
Real-time analysis with a modern visualization tools
There are many visualization tools in the market today that are used to help engineers analyze their test data. However, they are usually available as heavyweight native applications designed for a single user who has the time to acquire deep application expertise. These tools do not support the needs of an engineering team that must drive programs in real-time, making fast confident decisions as their program rapidly progresses. These tools just don’t fit well in the test and measurement D2M world – especially as engineering teams are increasingly global and distributed. The visualization tool for D2M teams must provide data access to the entire team, with well-known visualization capabilities such as histogram, sweep, box-and-whisker, and scatter plots.
Sweep plots or vector plots allow users to view 2-dimensional ‘sweep-data’. D2M and T&M applications rely heavily on sweep-data such as time-domain waveforms, frequency-domain magnitude plots, and eye diagrams. The right analytics tool will enable the team to overlay (for example) multiple eye diagrams with different test conditions. The overlay feature allows the user to determine test conditions that cause the eye to close or have less margin. The design engineer can use this information to optimize the design for best performance. Another example of a sweep/vector plot is a constellation diagram. Figure 1 shows an example of a 5G QAM4 constellation diagram. There are three sets of constellation data overlain which represent three different input voltages: 1V, 0.9V. and 0.8V. The plot shows us that the constellation diagram with input voltage of 1V has the cleanest transmitted symbol. The constellation diagram with input voltage of 0.8V appears to be the one with the lowest received signal quality with potential phase noise issues.
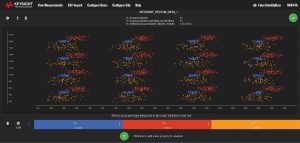
Figure 1. Overlay of 3 different input voltages (1V, 0.9V and 0.8V) 5G QAM4 constellation data.
Another popular visualization method in the test and measurement world is a box-and-whisker plot. Figure 2 shows an example of a box-and-whisker plot of a jitter measurement with multi-level split capability. The user can split on more than one property for analysis purposes. The plot on the left is split by the three usernames: Sakata, Fernandez, and Chang. The plot on right is split by username and input voltage. The plot indicated most of Changís measurement values are higher than the upper limit, especially for the input voltage of 0.8V.
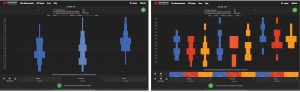
Figure 2. Box-and-Whisker plot of a jitter measurement with multi-level split capability.
In summary, successful D2M programs require a clear DOE and necessarily generate a great amount of data. With upfront planning and by choosing the right analytics platform, engineering teams can optimize effectiveness and time to market. This same data can also be leveraged into manufacturing ramp and manufacturing optimization.
—————————————————
Brad Doerr, R&D Manager, Keysight Digital Photonics Center of Excellence
Brad Doerr is the R&D manager for Keysight Technologiesí Digital and Photonics Center of Excellence. He leads R&D teams in the US, India, and Malaysia in the development of oscilloscopes, logic analyzers, probing, and software solutions. Mr. Doerr has held leadership roles in HP/Agilent/Keysight since 1988 focused primarily on digital communications and electronic measurement. Mr. Doerr holds a BSEE from the University of Minnesota (1988), MSCS Stanford University (1994), and has been granted 3 US patents.
Ailee Grumbine, Strategic Product Planner, Data Center Industry Solution Team
Ailee specializes in high-speed memory technologies such as DDR and SD UHS interfaces. She recently expanded her role in data analytics as the strategic planner. She graduated from the University of Science Malaysia in 2001 and completed a Masters of Business Administration from the University of Colorado, Colorado Springs. Prior to her current position, Ailee was a regional applications engineer with expertise in high-speed bus applications, which include DDR memory, physical layer, and protocol testing.